Perception
AUAV-PER-2026-01
The Atılım UAV perception stack is built around one hard constraint: the SUAS 150 ft AGL floor, which fixes 46 m nadir as the worst-case imaging geometry. A SIYI A8 mini gimbal camera feeds two streams — 720p to an onboard Jetson Orin NX for YOLOv11 detection of mannequins and tents, and 1080p down the SIYI HM30 link to the ground station for orthomosaic mapping. The detector is trained on 16,015 annotated images and reaches roughly 0.955 mAP@50 on the current run, with confidence falling to 0.3 on heavily occluded or partially framed targets. Mapping currently stitches from imagery alone; GPS integration, which turns the mosaic into the georeferenced product Risk Mapping requires, is the next milestone for that module. The open item that gates the delivery score is target geolocation — converting a bounding box into a latitude and longitude accurate to better than the 50 ft scoring radius.
PDF · 11 sayfa
1 Scope and Mission Drivers
This document describes the perception stack of the Atılım UAV Team: the imaging hardware, the object detection pipeline, the aerial mapping pipeline, the simulation environment used for integration testing, and the target geolocation chain that connects a detection in image space to a delivery waypoint in the world frame.
Two SUAS 2026 mission elements drive every design decision below. Risk Mapping requires a georeferenced orthomosaic of the search area. Search-Detect-Deliver requires the UAS to find one mannequin and one open pop-up tent inside the search boundary and to deliver a water bottle to the mannequin and a strobing beacon to the tent, all while remaining above the 150 ft AGL floor.
Those two requirements set what follows: the altitude the optics are sized for, the choice of camera, and the split of compute between aircraft and ground station.
2 Imaging Hardware and Compute
The first question we answered was whether a target could physically be resolved from the minimum legal altitude. SUAS enforces a 150 ft AGL (45.7 m) floor, so every optical decision was sized at 46 m nadir and that geometry was treated as the worst case.
The camera is a SIYI A8 mini 3-axis gimbal unit, shown in Figure 1. It carries a 1/1.7 in Sony sensor with 8 MP effective resolution, a fixed 21 mm equivalent lens at F2.8, and an 81° horizontal / 93° diagonal field of view; it weighs 95 g and draws 5 W average [6]. It outputs over Ethernet, and that Ethernet output is what lets us pull two independent streams at once — the reason this unit beat the alternatives on our list.
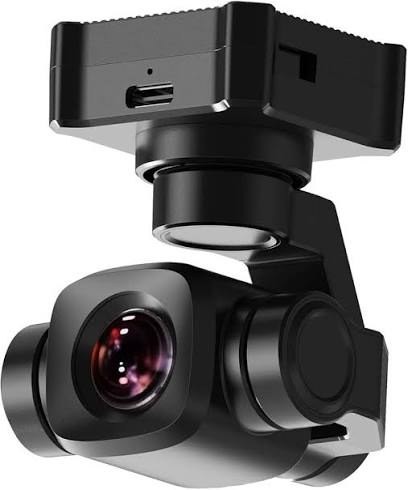
Figure 1. SIYI A8 mini gimbal camera: 95 g, 3-axis stabilized, 1/1.7 in Sony sensor behind a fixed 21 mm equivalent lens. Ethernet output rather than optical performance is what decided the selection — it carries two independent video streams at once.
2.1 Ground footprint and pixels on target at 46 m AGL
With an 81° horizontal FOV at 46 m nadir the camera covers roughly 79 m × 44 m of ground in a single frame. Dividing that footprint by the output resolution gives the ground sample distance, and multiplying by the physical size of a target gives the number of pixels the target will span. Table 1 works that through for all three output streams.
Table 1. Ground sample distance and pixels on target at 46 m nadir, for the three A8 mini output streams. The mannequin figure on the sub stream row is the number that constrains the design.
Stream | Resolution | GSD @ 46 m | Mannequin (~1.7 m) | Tent (~2.0 m) |
|---|---|---|---|---|
Still / 4K | 3840 × 2160 | ~2.0 cm/px | ~83 px | ~98 px |
Main stream | 1920 × 1080 | ~4.1 cm/px | ~42 px | ~49 px |
Sub stream | 1280 × 720 | ~6.1 cm/px | ~28 px | ~33 px |
The conclusion we drew from Table 1 shaped the whole pipeline. At 4K the targets are comfortably resolvable. At 720p a mannequin is only about 28 pixels across — near the lower bound of what a YOLO detection head reliably recovers, and that assumes the mannequin is fully exposed rather than partially occluded by bushes or vehicles, which the SUAS handbook explicitly warns it may be [1].
That resolution limit is a deliberate compromise rather than an oversight. The 720p sub stream is used for real-time detection on the Jetson because it is the stream that fits the latency budget, and it is therefore the resolution-limited path. The mitigation is to run inference on the 1080p stream, or to tile the frame and run inference per tile, whenever the latency budget on the Jetson allows it. Which of those we ship has to be settled with an on-Jetson benchmark, not on the development PC.
2.2 Compute and link
Detection runs on an NVIDIA Jetson Orin NX 16 GB carried on the aircraft. Video reaches the ground station through the SIYI HM30 link. Flight control is a CUAV X7+ PRO with a CUAV NEO 3 PRO GPS and RTK correction; Mission Planner and QGroundControl are used as ground control stations. Table 2 lists what each element contributes to perception.
Table 2. Perception hardware chain and the role each element plays. The flight controller and the GNSS receiver appear here only as pose and position sources, but they supply two of the five inputs the geolocation transform in Section 6 needs.
Component | Selection | Role in the perception stack |
|---|---|---|
Camera / gimbal | SIYI A8 mini | Dual-stream imaging, stabilized nadir capture |
Video link | SIYI HM30 | Air-to-ground transport of both streams |
Onboard compute | Jetson Orin NX 16 GB | Real-time YOLOv11 inference, MAVLink command issue |
Flight controller | CUAV X7+ PRO | Attitude and position source for geotagging |
GNSS | CUAV NEO 3 PRO + RTK | Position accuracy for georeferenced mapping |
GCS | Mission Planner / QGroundControl | Mission upload, telemetry, high-res stream display |
The stream split follows directly from where the compute is. The 720p sub stream stays on the aircraft and feeds the Jetson for detection; the 1080p main stream is sent down the HM30 to the ground station, where it feeds mapping and gives the operator a live picture. Codec is H.265 — H.264 was tried first and produced an unstable stream.
3 Object Detection
Before choosing a model we reviewed the Technical Design Reports of teams that competed at SUAS 2025 and compared what they used, what data they trained on, and whether their pipeline ran in real time. Table 3 summarizes that survey; of the five reports, the Alexandria University one [2] is the only one we hold a full citation for.
Table 3. Detection approaches reported by teams at SUAS 2025, as stated in their own Technical Design Reports. Every entry reported as real-time is a YOLOv11 variant; the two entries that are not real-time are the RF-DETR and DINOv2 + DETR pipelines.
Team | Model | Dataset | Real-time | Trade-off |
|---|---|---|---|---|
Alexandria Univ. | RF-DETR | 100% synthetic | No | Strong on small objects, expensive to train |
Ohio State | DINOv2 + DETR | Real + synthetic | No | Highest mAP, highest latency |
King Fahd Univ. | YOLOv11 | AirSim + real | Yes | Balanced FPS/accuracy, loses detail on downscale |
Hacettepe (Markut) | YOLOv11 | 30% synth + 70% real | Yes | Generalizes well, less sophisticated |
KAAN Tech | YOLOv11m | COCO + task objects | Yes | Low cost, weaker localization |
We selected YOLOv11. The deciding factors were real-time capability on an embedded target, an acceptable FPS/accuracy balance, and by far the widest availability of tooling, export paths and community material — which matters for a student team that has to debug quickly [3]. We adopted the 30% synthetic / 70% real data split as our target mix.
3.1 Dataset
The dataset is managed in Roboflow and currently holds 16,015 annotated images across the two mission classes, mannequin and tent. It is built from three sources: public aerial imagery that supplies scale, viewpoint and background diversity; our own drone footage of mannequins captured over campus and park terrain; and close-range studio images of mannequins that anchor the object appearance. Figure 2 shows the project as it currently stands.
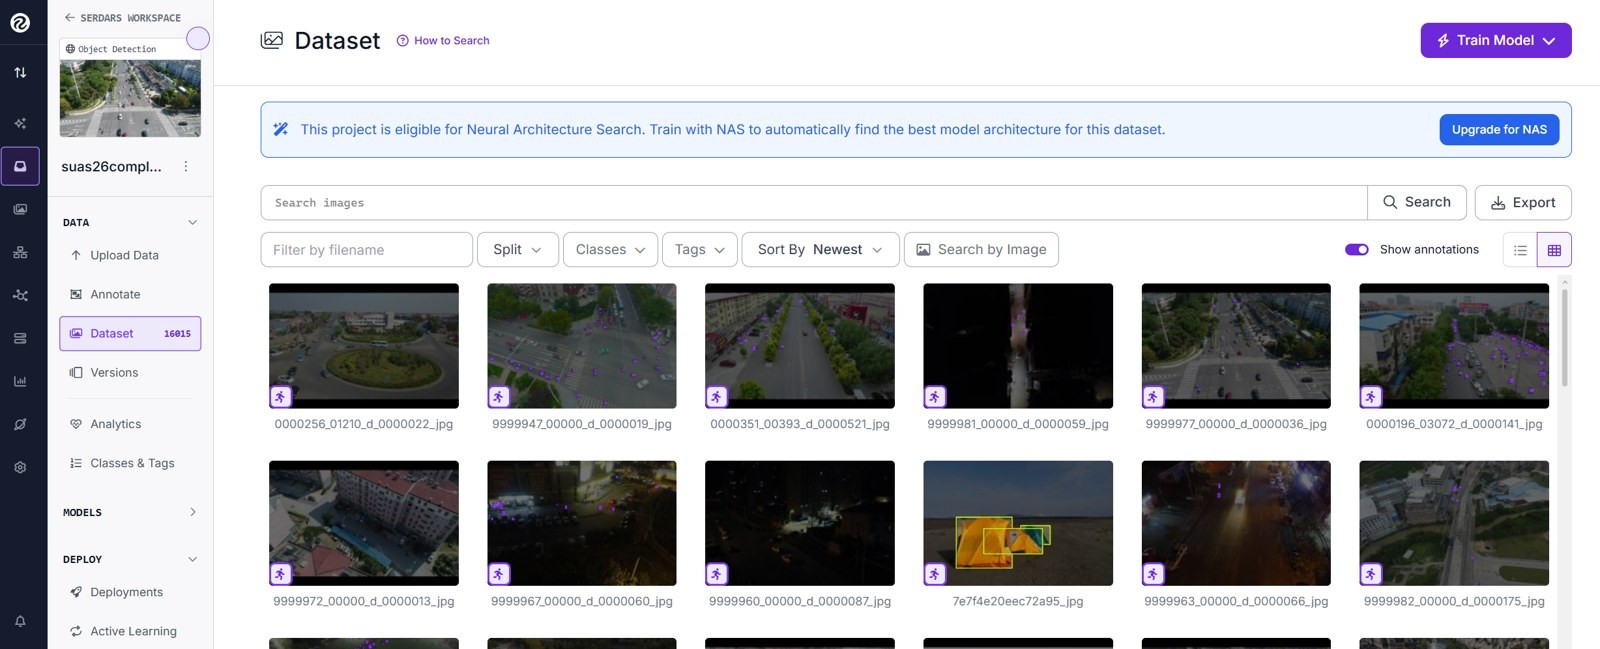
Figure 2. The Roboflow project at 16,015 images across the mannequin and tent classes. Most visible thumbnails are public aerial imagery of urban scenes — the source of the set's background and viewpoint diversity rather than of its target appearance.
The real-image capture campaign was flown on 19 May 2026. Mannequins were placed on grass, gravel, paving and bare soil, in the poses the handbook says to expect — lying down, seated, face-down — and were photographed at competition-representative altitude so that the apparent target size in training matches the apparent target size at competition. Partial occlusion cases were captured deliberately: legs visible under a bush, torso only, mannequin next to debris. Figure 3 is a sample of the labeled result.
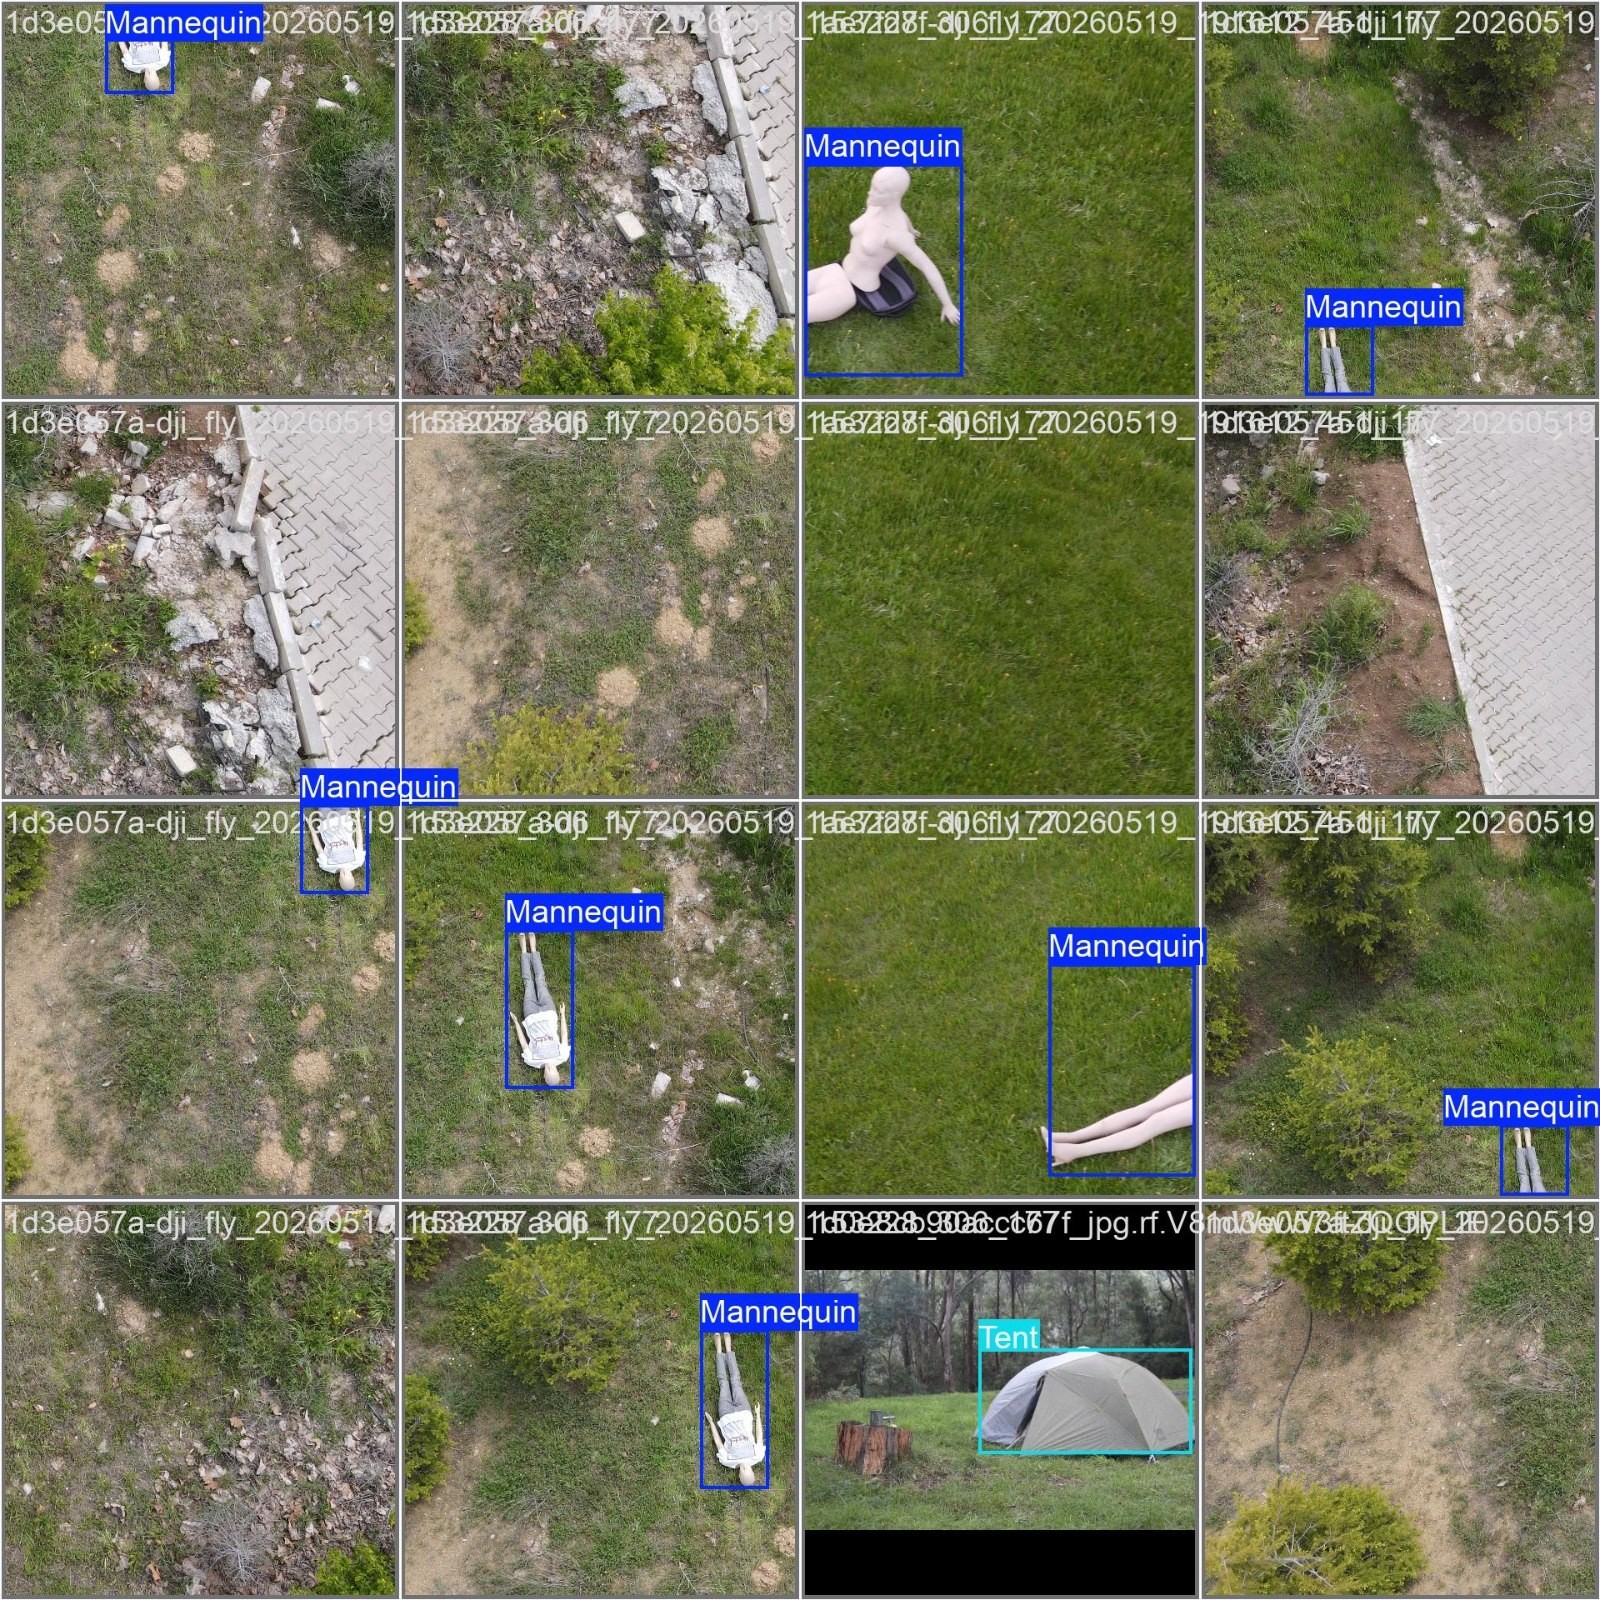
Figure 3. Labeled mannequin and tent instances in real drone imagery. Two things are deliberate and worth noticing: several tiles carry no box at all — frames of bare grass, gravel and paving are kept in the set as negatives — and several boxes enclose only a pair of legs, which are the partial-occlusion cases.
3.2 Training
Labeling was done in Label Studio and Roboflow; training runs on Google Colab with the Ultralytics YOLOv11 implementation, starting from pretrained COCO weights and fine-tuning on the custom set. Augmentation is applied at dataset generation time. The run reported in Table 4 converged over roughly 80 epochs.
Table 4. Detection metrics for the current training run, approximate values at the final epoch. The gap between mAP@50 and mAP@50–95 is where the remaining headroom sits.
Metric | Value (approx., final epoch) |
|---|---|
Precision (B) | ~0.92 |
Recall (B) | ~0.93 |
mAP@50 (B) | ~0.955 |
mAP@50–95 (B) | ~0.73 |
Epochs | ~80 |
Both training and validation loss curves (box, cls, dfl) decrease monotonically after the first few epochs with no divergence between them, so the model is not overfitting at this dataset size. mAP@50 plateaus around epoch 55; the remaining headroom is in mAP@50–95, that is, in localization tightness rather than in whether the object is found at all.
3.3 Validation on unseen footage
The model is validated on drone footage that was never part of training. Confidence on clearly exposed mannequins sits in the 0.6–0.9 band; heavily occluded or partially framed targets fall to 0.3, and some fully occluded instances are missed entirely. Figure 4 shows both ends of that range on one sheet.
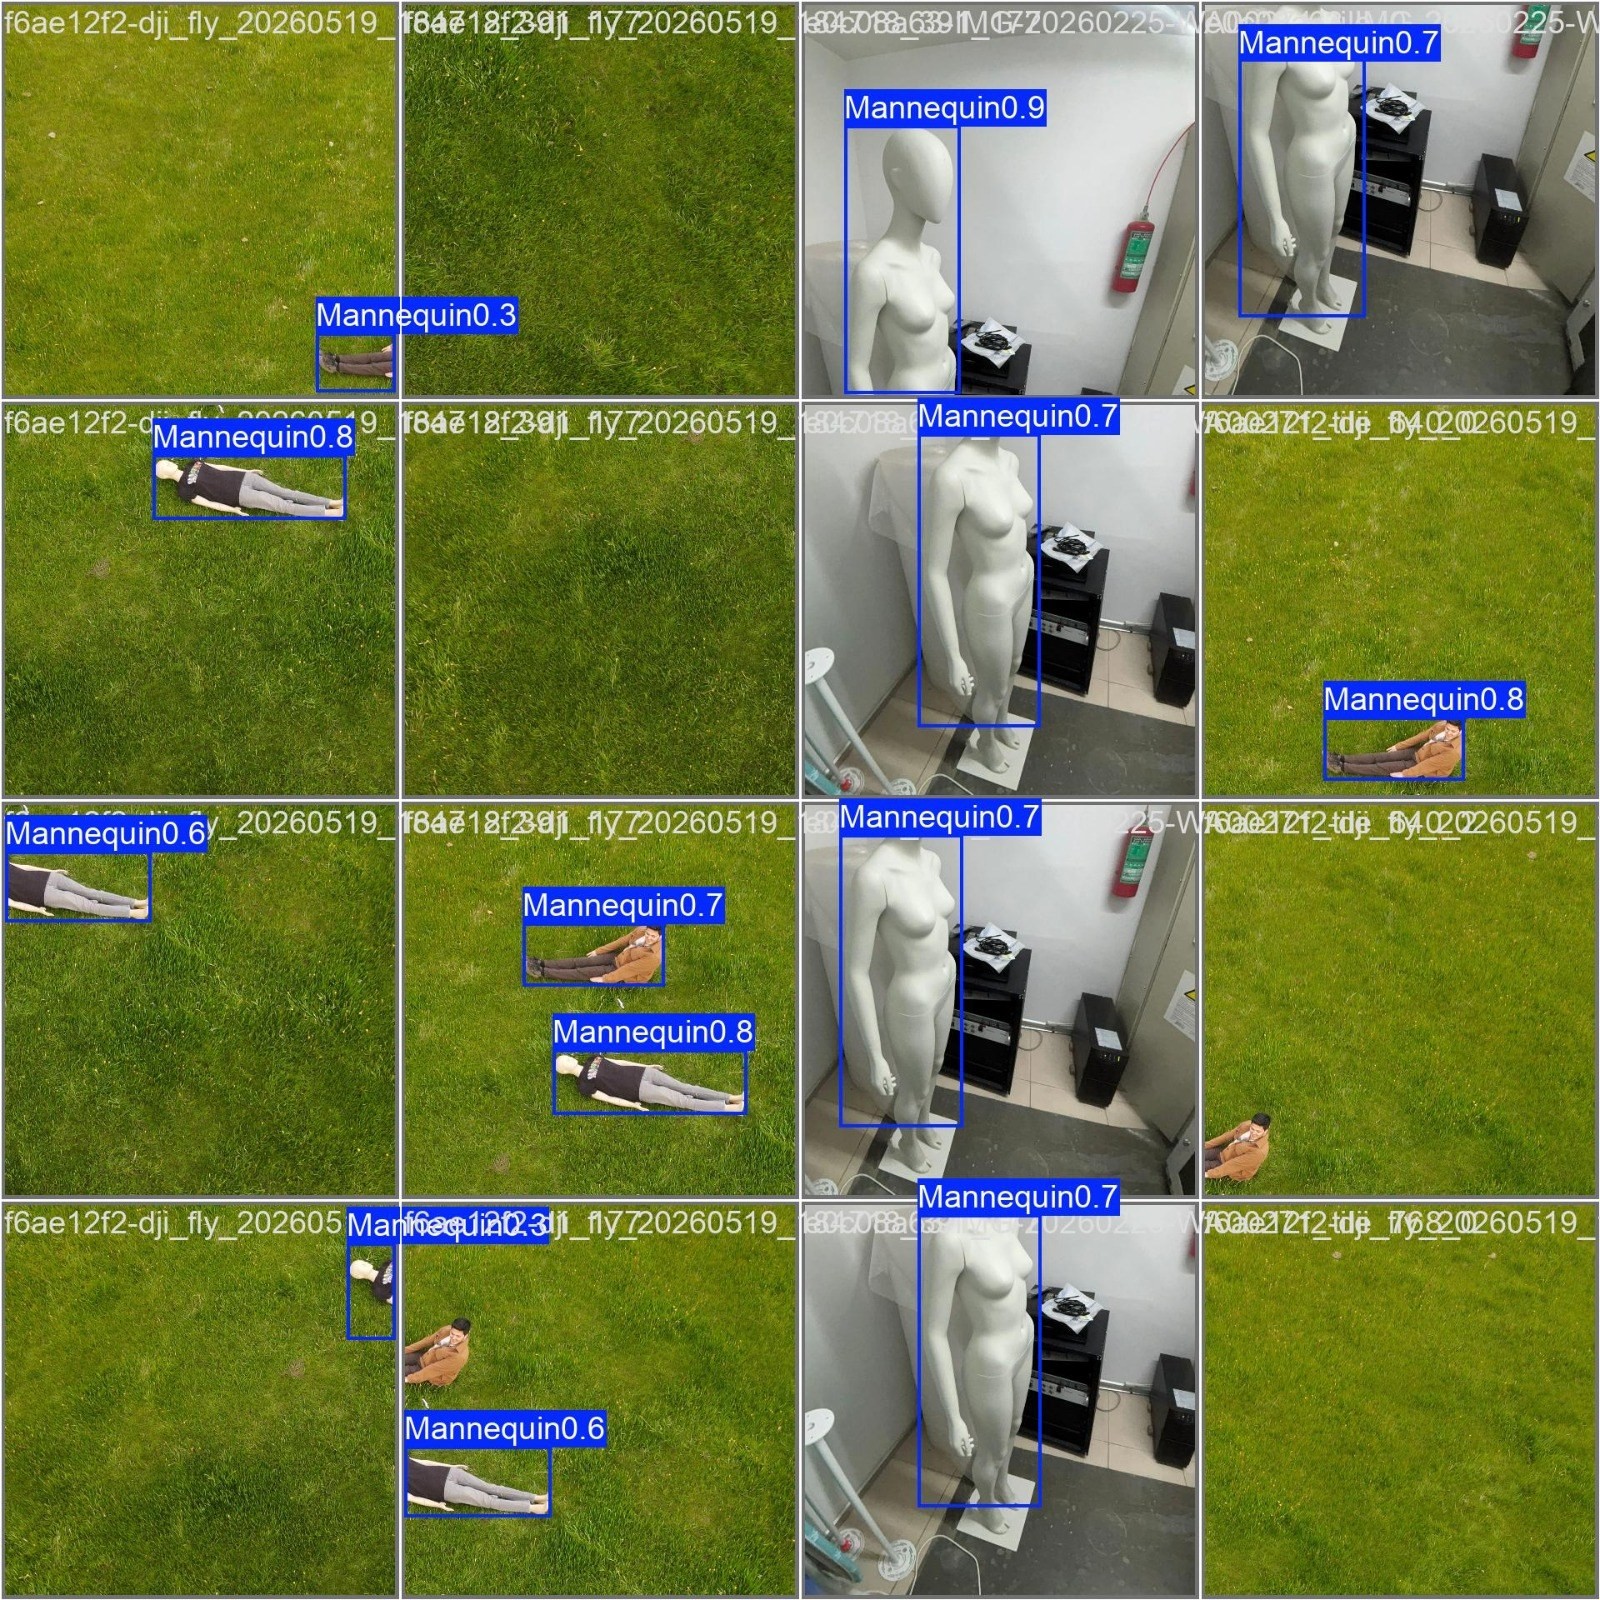
Figure 4. Validation predictions with confidence scores, aerial and studio mannequins mixed. The high-confidence boxes are fully exposed targets and the low-confidence ones are partially framed. Two miss cases are visible in the bottom-right tiles — a mannequin is present and no box is drawn.
One failure mode in this path is more serious than low confidence. The mannequin-only model has classified real humans as mannequins in earlier runs. Judges and other personnel may be inside the search boundary during a mission, so a false positive on a human would send a delivery toward a person rather than a target. Three mitigations are in progress: adding a human negative class to the dataset, keeping human-containing frames as hard negatives, and gating the delivery decision on a confidence threshold plus multi-frame agreement rather than on a single detection.
4 Mapping
The Risk Mapping task requires a single wide-area image of the search area. For this we are developing an OpenCV-based orthomosaic stitching module, organized under the suas_fast_orthomosaic project. The module extracts image features using algorithms such as SIFT and ORB and estimates homography transforms to align and merge consecutive frames [5].
At the current stage of development, stitching is performed from the imagery alone, without any coordinate information. Alignment relies entirely on the visual overlap ratio between consecutive frames. The purpose of this stage is to validate the core stitching algorithms in isolation, before the georeferencing layer is added on top of them. In the next development phase, GPS coordinates will be integrated to produce a georeferenced orthomosaic.
Mapping is executed on the ground station using the 1080p main stream, which keeps the Jetson free for detection. This follows directly from the stream split described in Section 2.2.
Two stitching tests have been run so far. Figure 5 is the first, over a scale model; Figure 6 is the second, over the flight-test field.
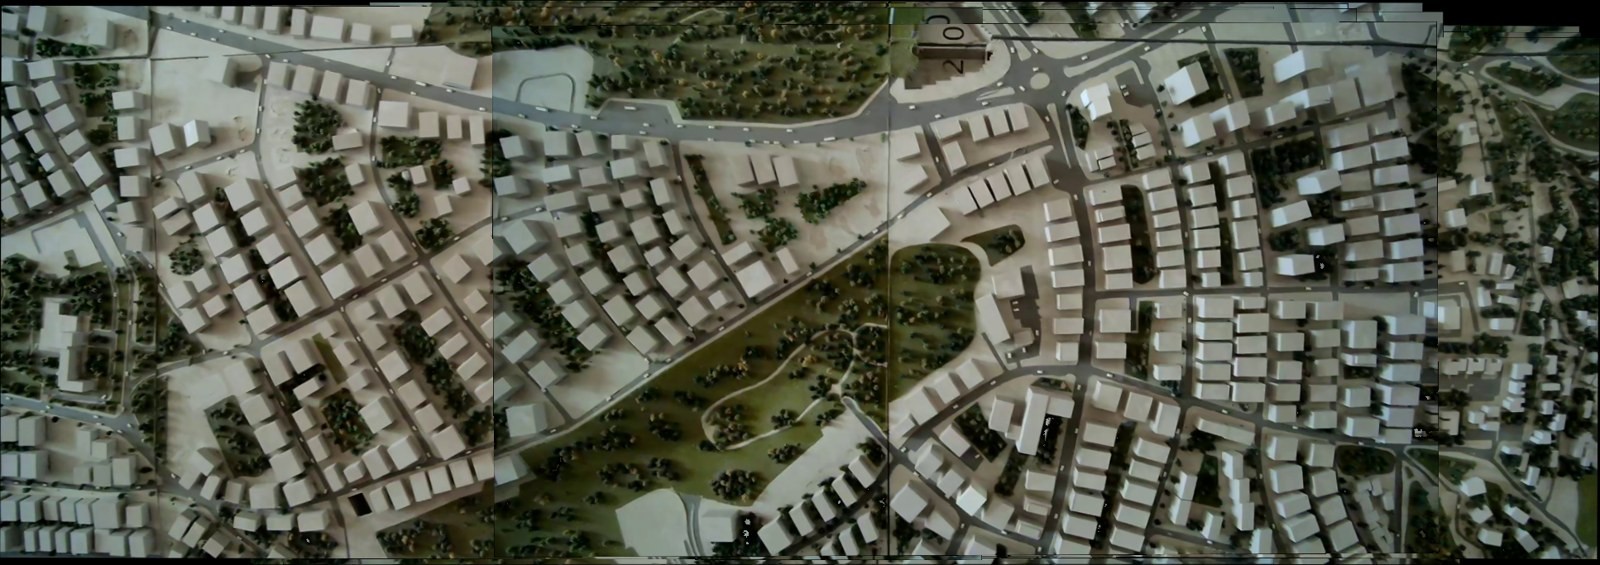
Figure 5. First stitching test, imagery captured over a scale model. No coordinate data is used — each frame is placed relative to its neighbor — and the upper and lower edges of the mosaic step rather than running straight.
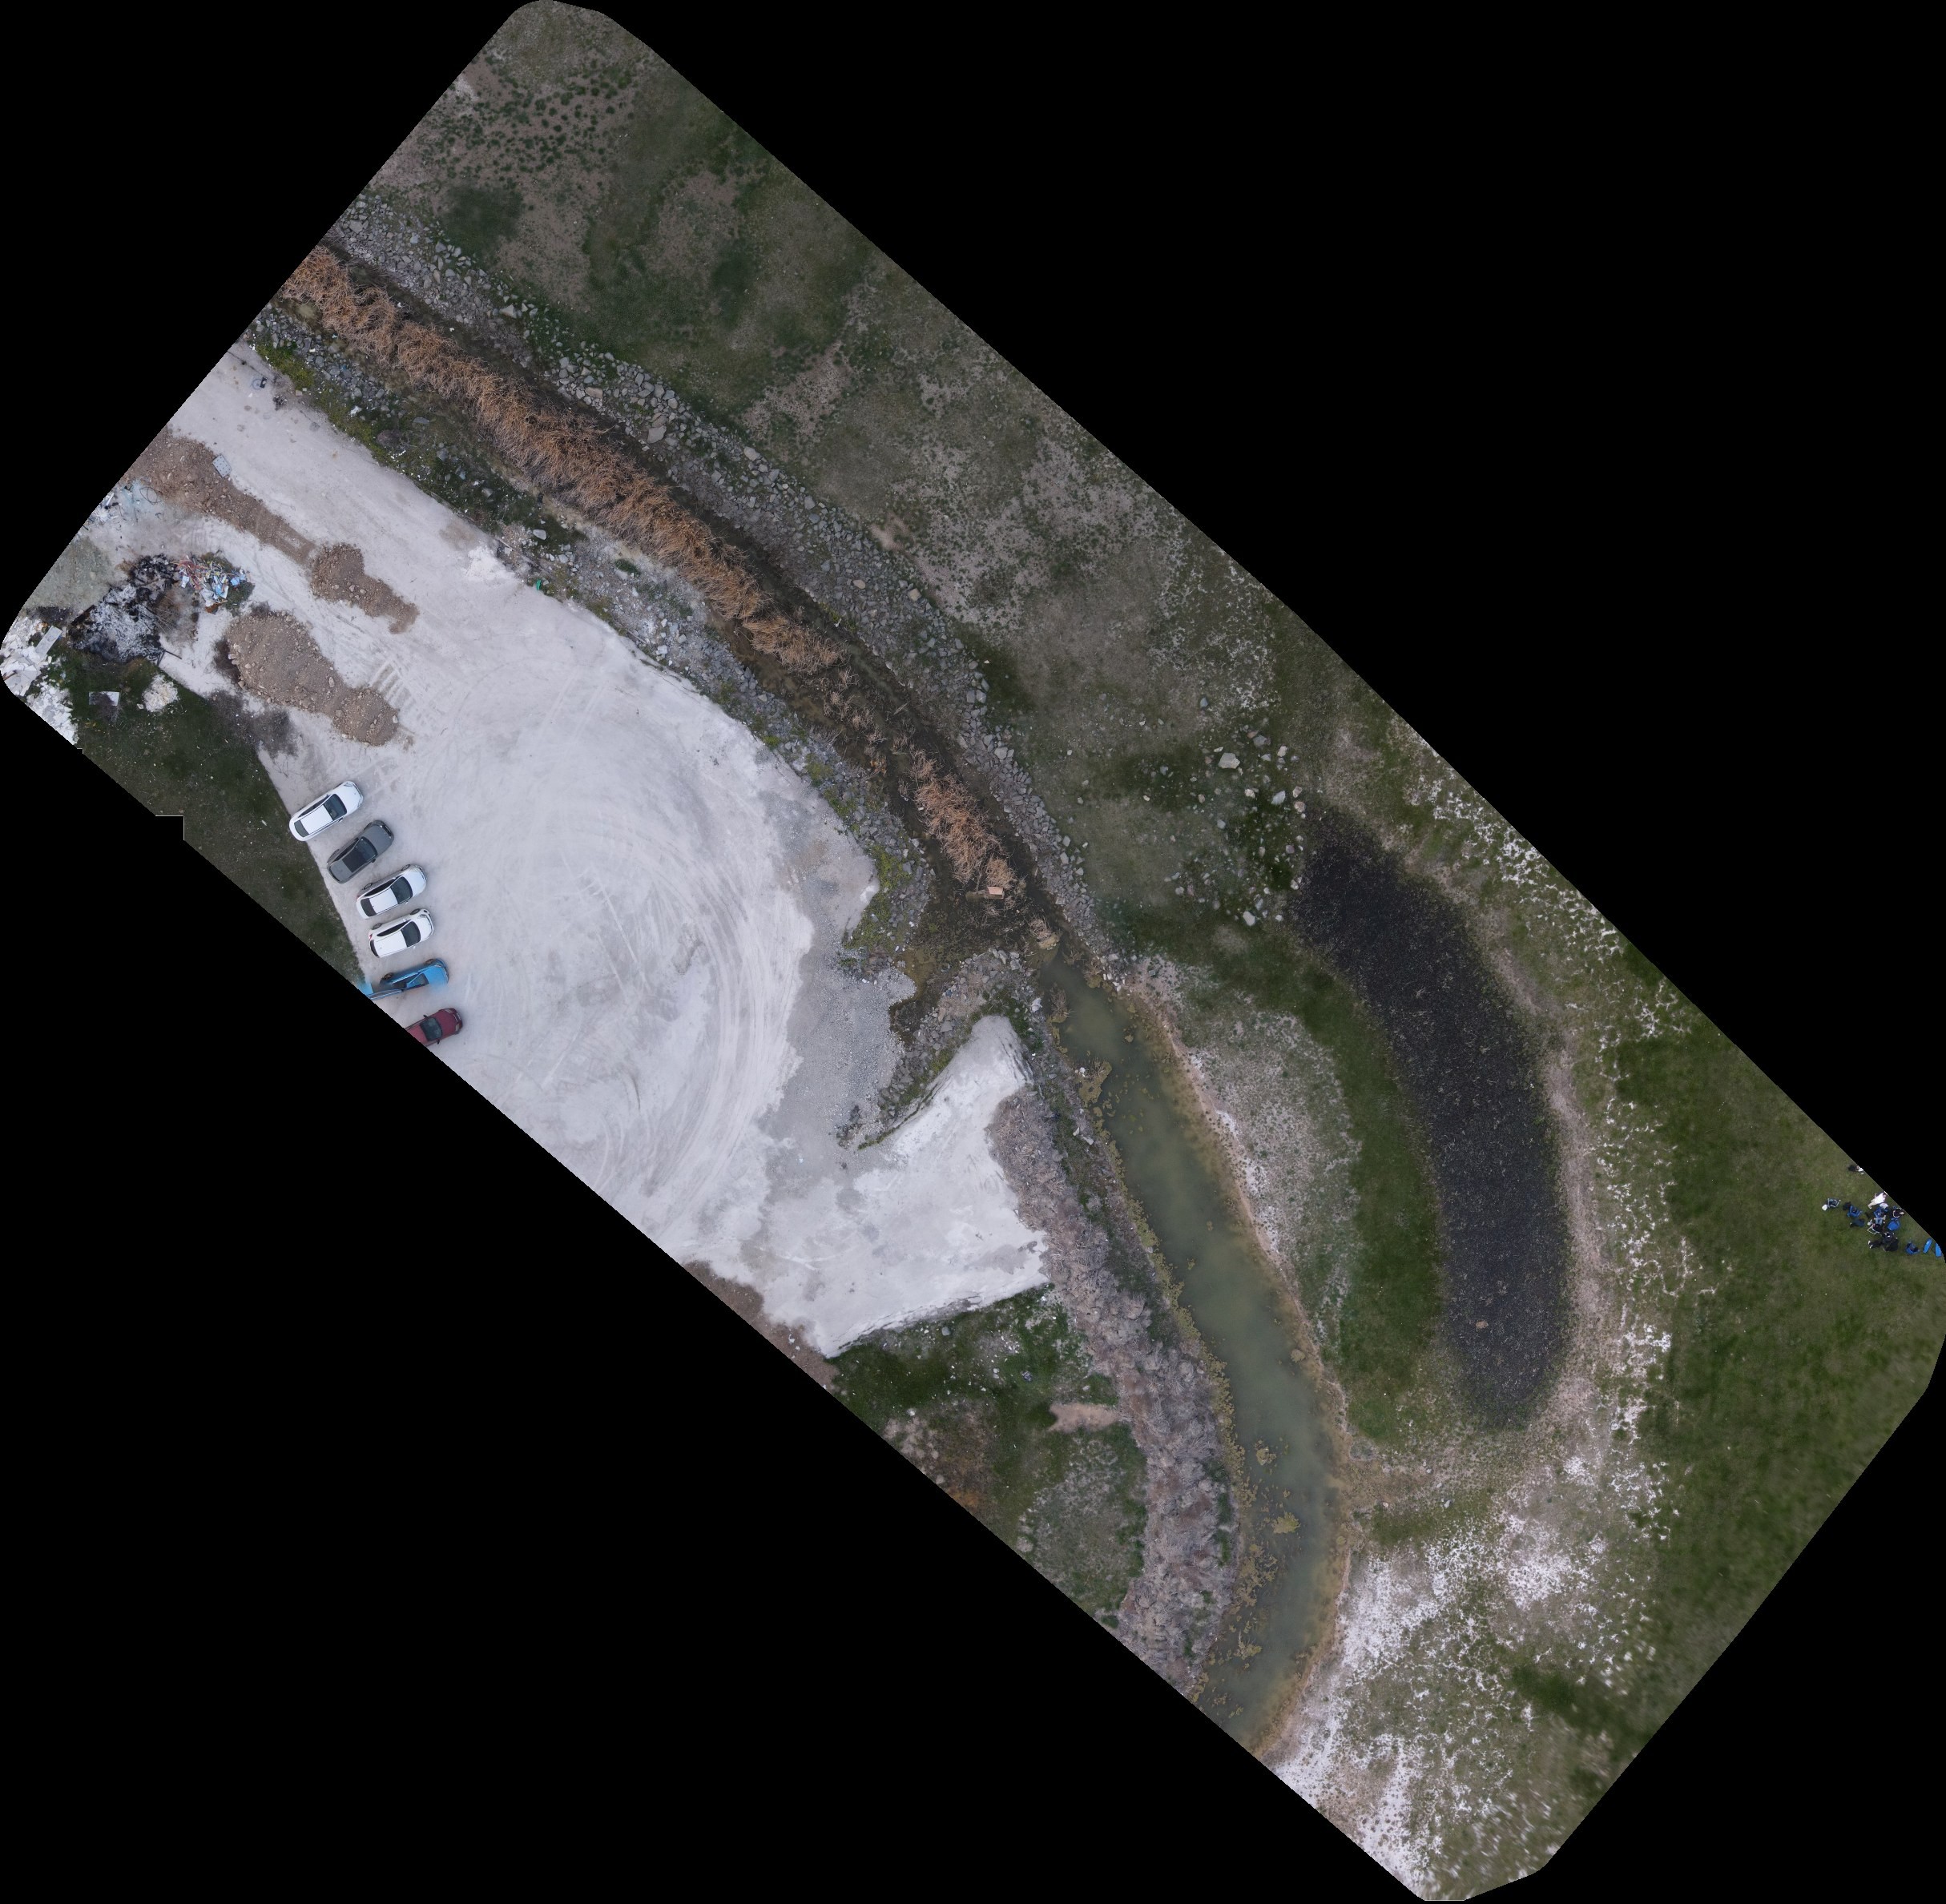
Figure 6. Second stitching test, over the flight-test field. The scene is natural ground cover — grass, gravel, bare soil, a graded lot and a watercourse running through the frame — rather than the built model of Figure 5. This run also used no coordinate data.
4.1 Test status
The orthomosaic module has been tested on sample aerial imagery. In the tests carried out so far, frames were merged using visual feature matching only, with no coordinate data. These tests have verified the basic functionality of the stitching algorithms. Georeferenced testing will begin once GPS integration is complete.
GPS coordinate integration is therefore the next milestone for this module. Until it is in place the output is a visually consistent mosaic rather than a georeferenced product, and a georeferenced product is what the Risk Mapping deliverable ultimately requires.
5 Simulation
We put a deliberate emphasis on integration testing in simulation this year, so that time in the field is spent flying rather than debugging. The environment is Gazebo with ArduPilot SITL, driven through QGroundControl and MAVProxy — the same autopilot firmware and the same MAVLink interface as the real aircraft, so test behavior transfers.
The scenario in Figure 7 runs a 55-waypoint survey mission. At each waypoint the vehicle holds, the capture routine triggers, and the frame is written to disk with the capture position encoded in the filename and a JSON sidecar carrying the full pose. This produces exactly the geotagged image set that the georeferenced orthomosaic will consume once GPS integration of the mapping module is complete, and it lets that integration be developed and tested without requiring a flight.
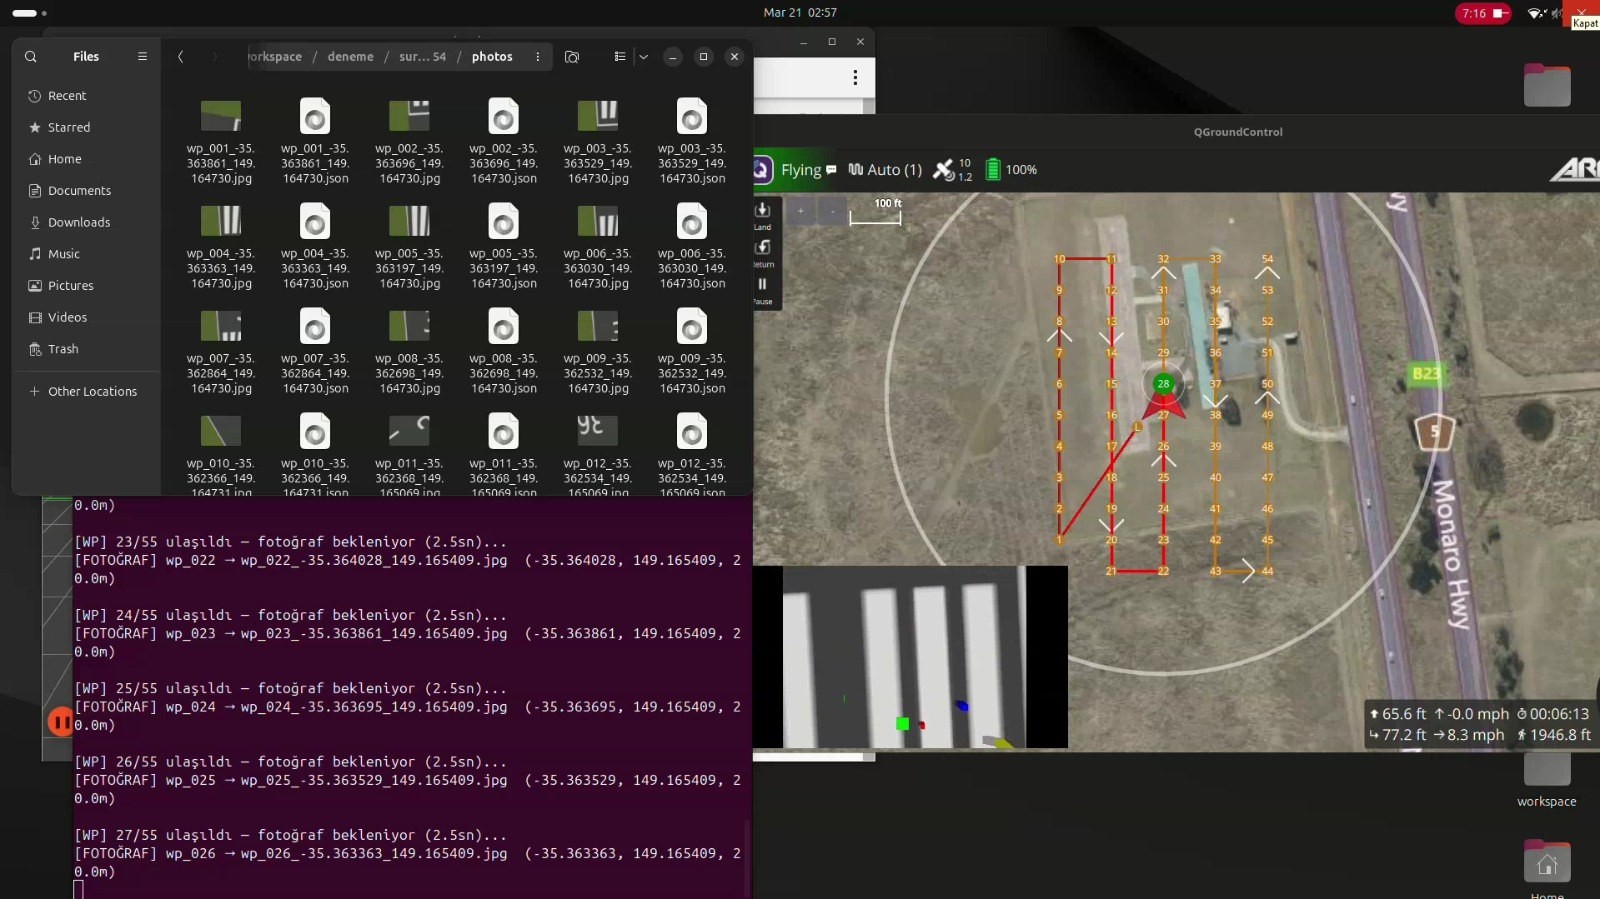
Figure 7. Gazebo, ArduPilot SITL and QGroundControl running the 55-waypoint survey. The file browser on the left is the point of the exercise: each waypoint produces a JPEG whose filename carries the capture latitude and longitude, paired with a JSON sidecar holding the full pose.
MAVLink command handling is tested in the same environment: GUIDED mode entry, arm, autonomous takeoff to a set altitude, waypoint navigation, controlled landing and disarm. Commands are signed [4]. One defect is open against that signing implementation: during SITL testing we observed that a connection could in some cases be accepted even when an incorrect signing key was presented. This is a security defect in our implementation, it is under investigation, and it is tracked as open.
Simulation results do not transfer unconditionally, and two classes of measurement are treated as untrustworthy until re-taken on the target hardware. Gazebo holds roughly a 1.0 real-time factor on the development PC but drops to about 0.4–0.7 on the Jetson Orin NX under load, which distorts control-loop behavior. Inference FPS measured on a desktop GPU likewise does not predict Jetson performance; TensorRT FP16/INT8 export changes it by 2–4×. Development iterates on the PC; every latency-critical result is re-validated on the Jetson before it is trusted.
6 Target Geolocation
Detection alone does not complete the mission. The output of the detector is a bounding box in image coordinates; the delivery system needs a latitude and longitude. The module that converts one into the other is the link between perception and action.
The transform uses the pixel coordinates of the box center, the camera intrinsics, the gimbal attitude, the vehicle attitude and position from the flight controller, and a flat-ground assumption at the known field elevation, to project the detection ray onto the ground plane and solve for the intersection. That intersection is the target coordinate; it is then issued to the flight controller as a waypoint over MAVLink [4]. Table 5 sets out the full chain from frame to release and where each stage currently stands.
Table 5. Detection-to-delivery chain, stage by stage. Capture and detection are working; geolocation and approach are both still in development, and the command stage that sits between them is working in SITL only.
Stage | Input | Output | Status |
|---|---|---|---|
Capture | A8 mini sub stream | Frame + timestamp | Working |
Detection | Frame | Class + bounding box | Working |
Geolocation | Box + pose + intrinsics | Target lat/lon | In development |
Command | Target lat/lon | MAVLink waypoint | Working in SITL |
Approach | Waypoint | Controlled approach + release | In development |
Accuracy here is directly scoreable. SUAS awards 50 points for landing a payload within 50 ft of a target and a further 30 points for delivering the correct object to the correct target [1]. A geolocation error budget larger than the 50 ft radius costs those points regardless of how good the detector is. That is why geolocation is the highest-priority open item in the perception stack: every other component in the chain is already functional, and this one gates the delivery score.
A related control issue is tracked alongside it. During simulated approach the vehicle accelerates toward the target fast enough that the camera loses it, which triggers a re-search. Approach speed shaping is being addressed as part of the same chain.
7 Ongoing Work
Four test activities are planned for the coming period. The first two exercise the modules described in Sections 4 and 3; the third exercises them together; the fourth addresses the security defect recorded in Section 5.
GPS-referenced orthomosaic tests
YOLOv11 model training and validation tests
End-to-end system integration tests
Resolution and verification of the MAVLink signing vulnerability
References
[1] RoboNation, "SUAS 2025 Team Handbook," 2025.
[2] Alexandria University, "Alex Eagles Technical Design Report," SUAS 2025.
[3] Ultralytics, "YOLOv11 Documentation." [Online]. Available: https://docs.ultralytics.com
[4] MAVLink, "MAVLink Developer Guide." [Online]. Available: https://mavlink.io
[5] OpenCV, "Feature Matching + Homography," OpenCV Documentation.
[6] SIYI Technology, "A8 mini User Manual v1.6," 2024.